Number of Diagnoses of HIV Infection, 2016

Transmission Category: Adult and Adolescent Males Adult and Adolescent Females Total
Male-to-male sexual contact 26,6570 N/A 26,570
Injection drug use 1,285 939 2,224
Male-to-male sexual contact and injection use 1,201 N/A 1,201
Heterosexual contact 3,037 6,541 9,578
Other 38 49 87

Source: Centers for Disease Control and Prevention
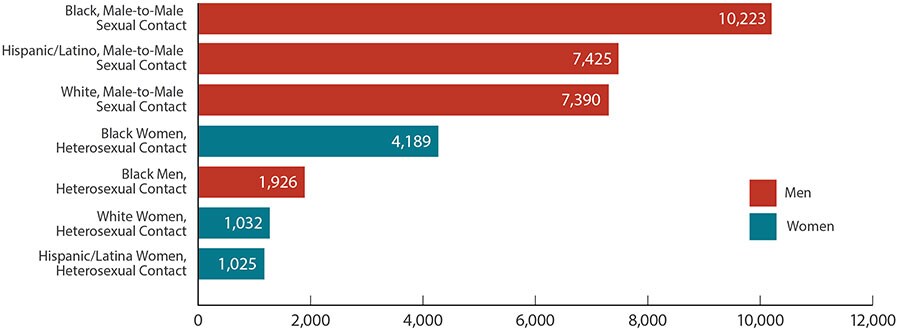
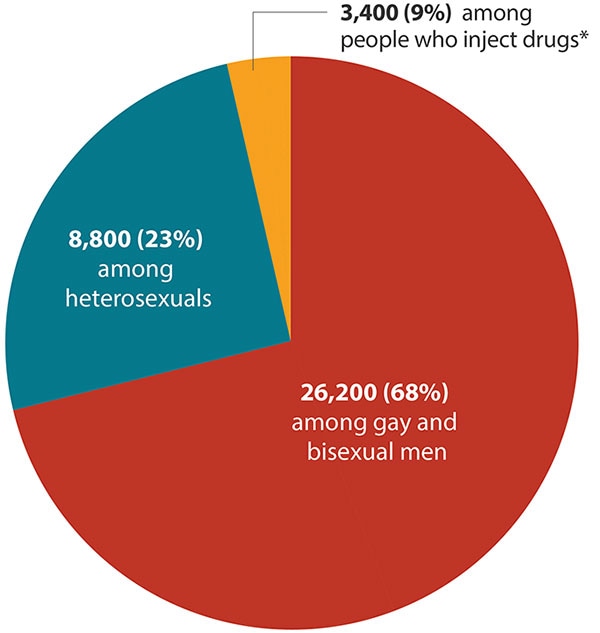
This chart shows new HIV diagnoses in the United States in 2016 for the most-affected subpopulations. Black male to male sexual contact = 10,223; Hispanic/Latino male to male sexual contact = 7,425; white male to male sexual contact = 7,390; black heterosexual women = 4,189; black heterosexual men = 1,926; white heterosexual women = 1,032; Hispanic/Latina heterosexual women = 1,025.This pie chart shows new HIV infections in the United States in 2015 by transmission category. Gay and bisexual men = 68% (26,200); heterosexuals = 23% (8,800); people who inject drugs = 9% (3,400)

Source: Centers for Disease Control and Prevention